Data reports pull together statistics from different channels to give a clear picture of what’s happening. Each report type includes report sub types that focus on specific areas, making it easy to dive into the details and spot useful insights.
Existing Data Reports can also be loaded and edited as required, so you could generate the same report but with different dates, without having to input all the other settings again. See Edit Data Reports.
Interactive Guide to creating a Data Report #
Click on the numbers to learn more about the process of creating a new data report.
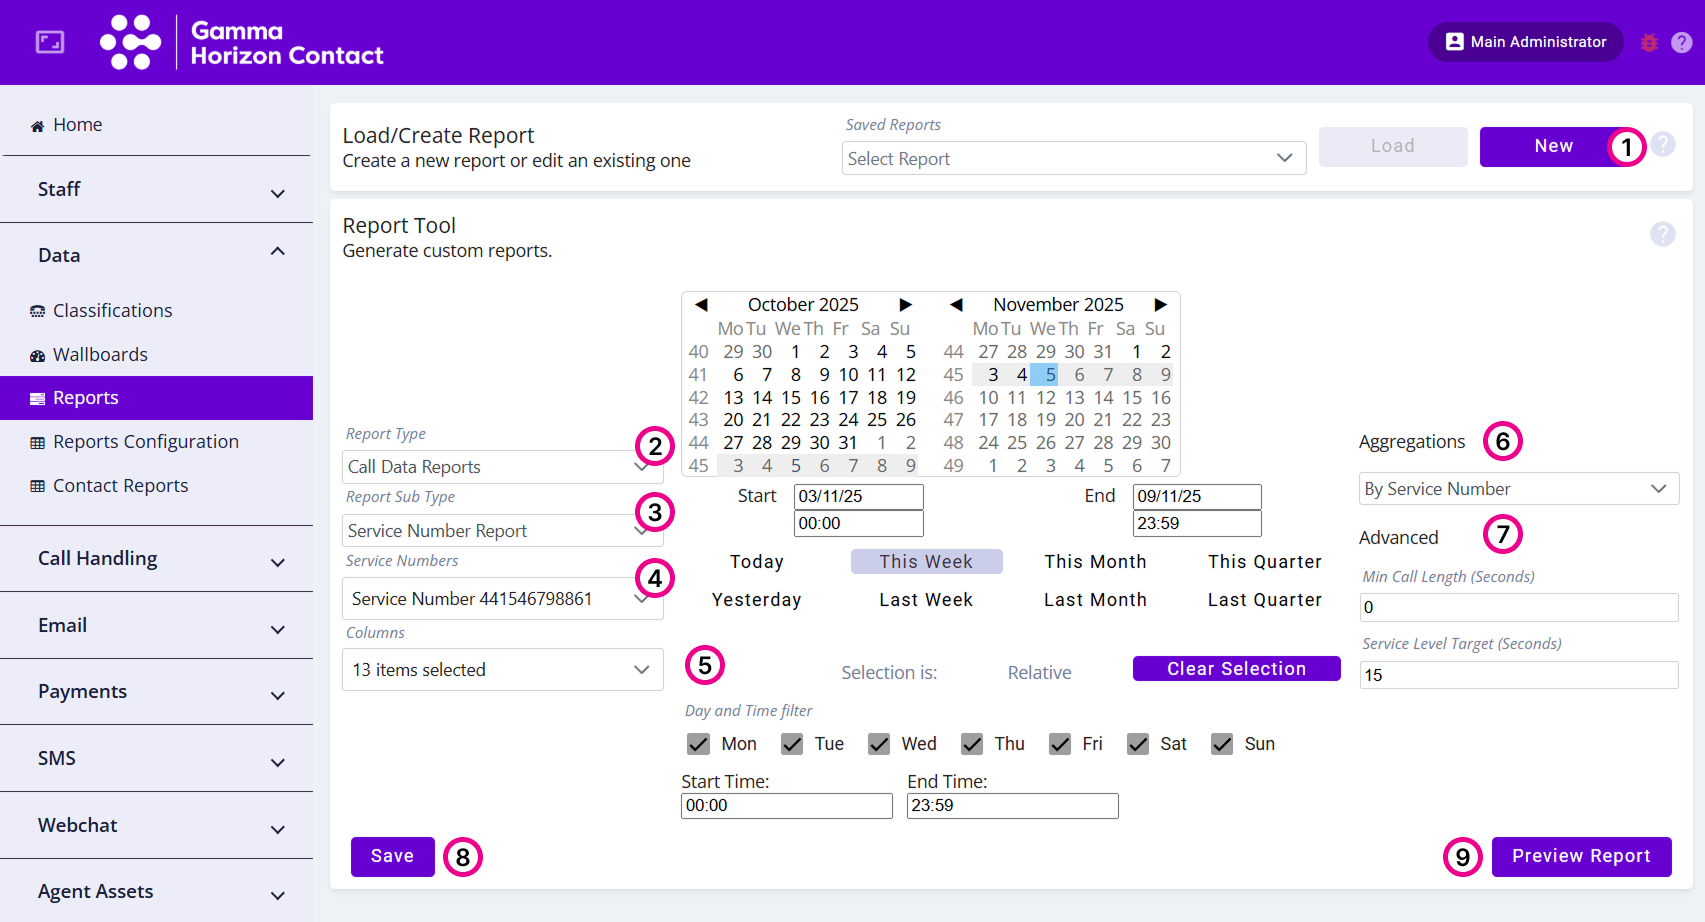
Create a Data Report #
- Navigate to Data → Reports
- Click New
- Select the Report Type
- Select the Report Sub Type
- Select the data source to refine the statistics to be included in the report
- The options will depend on the Report Sub Type
- Select the specific columns to display in the report
- Configure the time range the report looks at. There are multiple ways to do this:
- Configure days/weeks/months/quarters by selecting the relevant time period on the calendar
- Enter the required time range using the Start and End fields, dates can be entered in DD/MM/YY or DD/MM/YYYY format
- Select one of the pre-defined time range buttons (Today/This Week/Last Month etc)
- If required, apply a Day and Time filter:
- Change the days by ticking the days you want to include in the report
- Enter the Start and End time
- Select the Aggregations from the dropdown list
- The options will depend on the report sub type
- If required, specify further Advanced Parameters
- This is only available on some Report Sub Types
- Check the information in the report by clicking Preview Report
- Click Save
- Enter a name for the Report
- Click Save
The report will be created and added to the list of reports available to be loaded.
| Note: To see what data sources and aggregations are available depending on the Report Sub Type please refer to the Data Reports – Data Source and Aggregation options article on the Administrator Knowledge Base. |
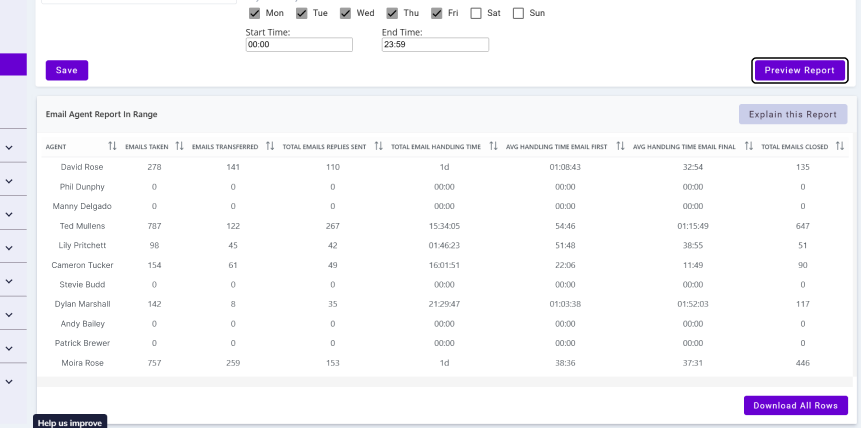
Previewing a Report #
To check the information that is being included in a report you can use the report preview feature. This will generate a preview of the selected report showing up to 500 rows of data.
| Note: Reports containing more than 500 rows of data will need to be exported for offline analysis. |
Exporting a Report #
To see a report in full and conduct in depth an analysis it’s recommended to download the report. Reports are downloaded in CSV format.
- Navigate to Data → Reports
- Using the Saved Reports dropdown, select the report
- Click Load
- Click Preview Report
- To export the entire report:
- Scroll to the bottom of the preview
- Click Download All Rows
- To only export specific rows:
- Select the rows you wish to export
- Scroll to the bottom of the preview
- Click Download Selected Rows
A CSV file containing the data will be downloaded to your computer.
Automatic exports #
Saved reports can be configured to be generated automatically at scheduled intervals. It’s possible to configure reports to be automatically transferred to an external platform via SFTP and sent to an email address.